Article · 17 September 2026 · 7 min read
Start with the decision: designing a model that informs your strategy
By Doryan Gowty, Principal, Anneal
Following my previous two posts on the agentic platform I built for a small eCommerce business, covering its workflows and evaluation framework, I want to move on to the modelling and analytics side. This one looks at model specification, particularly when a model is there to inform a decision or run scenario analysis.
This isn't a recipe for building a marketing-mix model. There are plenty of those. It's about the choices you make before you write a line of model code, and why those choices should come from the decision the model serves rather than the data you happen to have.
A model built to explain vs a model built to act
Most models are specified to explain. You gather what you have, fit it, and report which variables matter. That's fine if the output is a slide.
A model that sits inside a decision is held to a different standard. Someone is going to change a budget, a price or a production plan because of what it says. So it has to answer "what happens if we do this instead?", which is a counterfactual question, not a descriptive one. It has to take the things the business actually controls as inputs, and it has to produce outputs in the units the business actually cares about.
The question I started with for this brand was "where does the next dollar of ad spend work hardest?" Within a few months the same model was being asked the opposite question: stock is running low, the next production run is two weeks away, how much should we slow demand so the shelves don't empty? A model specified only to attribute revenue to channels couldn't have answered that. One specified around the decision could.
Draw the decision first: influence diagrams
A tool I find really useful is an influence diagram. They come out of decision analysis (Howard and Matheson formalised them in the early 1980s) and they're deliberately simple. I've also used this analysis working on optimisation projects to help define my objective function. Influence diagrams contain a small number of elements:
- Decisions (rectangles): things you control. Spend by channel, price.
- Uncertainties (ovals): things you don't control but that affect the outcome. Seasonality, how customers respond to ads, demand.
- Deterministic nodes: things that follow by arithmetic once you know their inputs. Revenue is price × units.
- Value (hexagon): the thing you're actually trying to improve. Here, contribution margin.
Arrows show what influences what. Here's roughly what this business looks like:
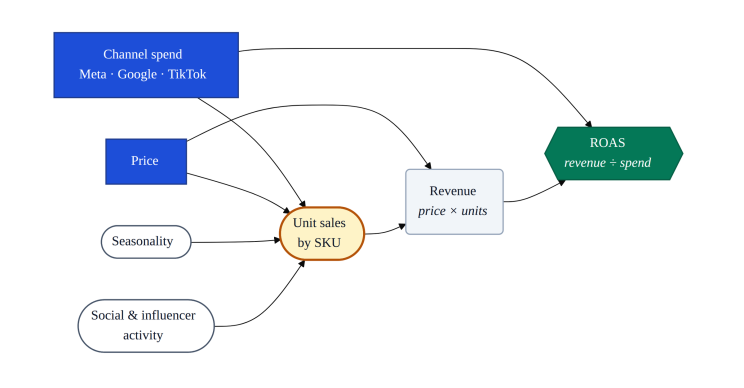
The value of drawing this isn't the picture. It's that it forces two questions most model specs never ask out loud: which node is genuinely uncertain and worth modelling? and which nodes are just arithmetic?
In this diagram there's only one node that needs a statistical model: unit sales. Everything downstream of it is bookkeeping. That observation drove most of the design choices below.
Model Output: model unit sales, not revenue
Marketing-mix models treat revenue as their target. I made a deliberate choice to target unit sales instead.
Price is a decision, so it can't be buried inside the outcome. Revenue is price × units. If you model revenue directly, price sits on both sides of the equation, and the model can't cleanly separate "people bought fewer" from "people paid less". By choosing units, price becomes an input like any other lever, its effect on sales can be captured independently and it can become its own lever when different scenarios are being considered.
The operational constraints are in units. Stock is counted in cases, not dollars. Production runs are measured in units. The inventory question posed above only works because the model speaks the same language as the warehouse. At the sell-rate at the time, stock would run out in about 12.5 days against a production run 14 days away. Running the Meta response curve backwards gave a spend cut of roughly $93 a day to bring demand down to the 107 units a day the remaining stock could sustain. That's one line of arithmetic on a units model and a messy, assumption-laden conversion on a revenue model.
Margin varies by product. Different SKUs carry different margins. Keeping the model in units and converting to dollars downstream means a change in cost or pricing doesn't require refitting anything.
The general point: model the uncertain quantity closest to the decision, and let arithmetic do the rest. Anything you can compute exactly, you shouldn't be estimating.
Model Specification: pool across products, not channels
Specification doesn't just talk to the technique being used but the model inputs and how they interact with each other. A conscious decision with this model was to use a hierarchical structure, with partial pooling across product SKUs. Marketing channel as an independent, qualitative variable rather than as a level of the hierarchy.
Pooling across SKUs matches how the decisions are made and how the data is shaped. Stock and production are managed at the SKU level, so that's the level the model has to speak to. At the same time, many SKUs have thin, noisy sales histories on their own. Partial pooling allows the model to deal with low volume SKUs. Its estimates get pulled towards the group where there is thin data.
Pooling across channels is a different proposition. There are only three paid channels here, and they aren't interchangeable. A dollar on TikTok and a dollar on Meta reach different people in different ways. With so few groups, a hierarchy has very little to learn about how much channels differ from each other. Treating channel as its own explicit effect is simpler, and it's easier to explain to the people who have to act on it.
The design question to ask isn't "should this be hierarchical?" but "across which dimension are the units similar enough to share information, and numerous enough to learn how similar they are?"
Decision Variables: How should the model behave?
The purpose of this model is to understand how changing marketing spend or price impacts unit sales for this business. Certain relationships are expected to hold; as price rises, unit sales should fall and any increase in marketing spend should reasonably see an increase in unit sales. We would also expect to see diminishing returns the further we push these variables in either direction.
I trained a hierarchical bayes model to estimate unit sales in this instance with priors defined on each of the model parameters.
Priors do two jobs here. First, they regularise. Where you have a genuine expectation about a coefficient, such as price having a negative effect on units, a prior stops noisy data from producing a coefficient that makes no commercial sense. Second, they carry the model through thin data. Two of the three channels had very little spend history, and without a sensible starting point their estimates would have been driven by noise.
Omitted Variables: include what you don't control
It's tempting to put only your levers into a decision model: spend and price. However, it's important to try and control for external influences on your model outcome. In this instance seasonality and social media and influencer activity data were available and these can influence sales just as much.
Model Limitations
A model built for decisions should be judged by how well its recommendations hold up, not how well it fits history. This is an important consideration when evaluating models for decision making. Pure performance on a single model performance metric is not the criteria we should be using to decide whether a model is fit for purpose in this instance. How the model behaves as its assumptions are tested matters more.
Observational data only. Spend was set by habit, not by experiment, so there's limited variation for the model to learn from. Response curves outside the range of past spend are extrapolation, however confident the curve looks and running experiments on your marketing spend and pricing settings helps to improve the quality of the decision.
The model and solver favour the channel it knows best. Following from the above point, there's no simple trick to deal with poor data. Your scenario analysis can quickly provide spurious results where there is little data for the model to draw from. Deliberately generating spend variation on the thinner channels provides evidence for the model to learn from.
The spec is decided by the decision
Almost none of the choices above were about which algorithm to use. They came from asking what decision the model serves, drawing it, and noticing which parts are genuinely uncertain. That told me what to model (units), at what level (SKU), what to constrain (price), and what I couldn't afford to leave out (the things the business doesn't control).
The solver is live on the case study at anneal.io, built on the fitted model. You can move spend between channels and compare your allocation against the model's own optimum. My next post will explore the architecture of the DTC eCommerce platform and how your agents, tools and code should work together.